v0.2.0
April 23, 2025What's Changed
- Customizable polling options on app run by @sebastian-quintero in #13
New Contributors
- @sebastian-quintero made their first contribution in #13
Full Changelog: v0.1.5...v0.2.0
nextmv-v0.23.0
April 23, 2025What's Changed
- Add run queueing constructs by @sebastian-quintero in #81
Archive file downloads
April 23, 2025
A small update to the behavior for downloading run input and output ZIP files was made. Before, when you downloaded a ZIP file from the run (input or output), the files within the ZIP file would be automatically extracted and downloaded individually.
This auto-extraction has been disabled and now the ZIP file is downloaded as a single file that you can then extract as needed via your operating system (e.g. double click the file). This keeps all of the files in a single directory rather than spreading them out wherever they were downloaded.
Column pinning in table views
April 22, 2025
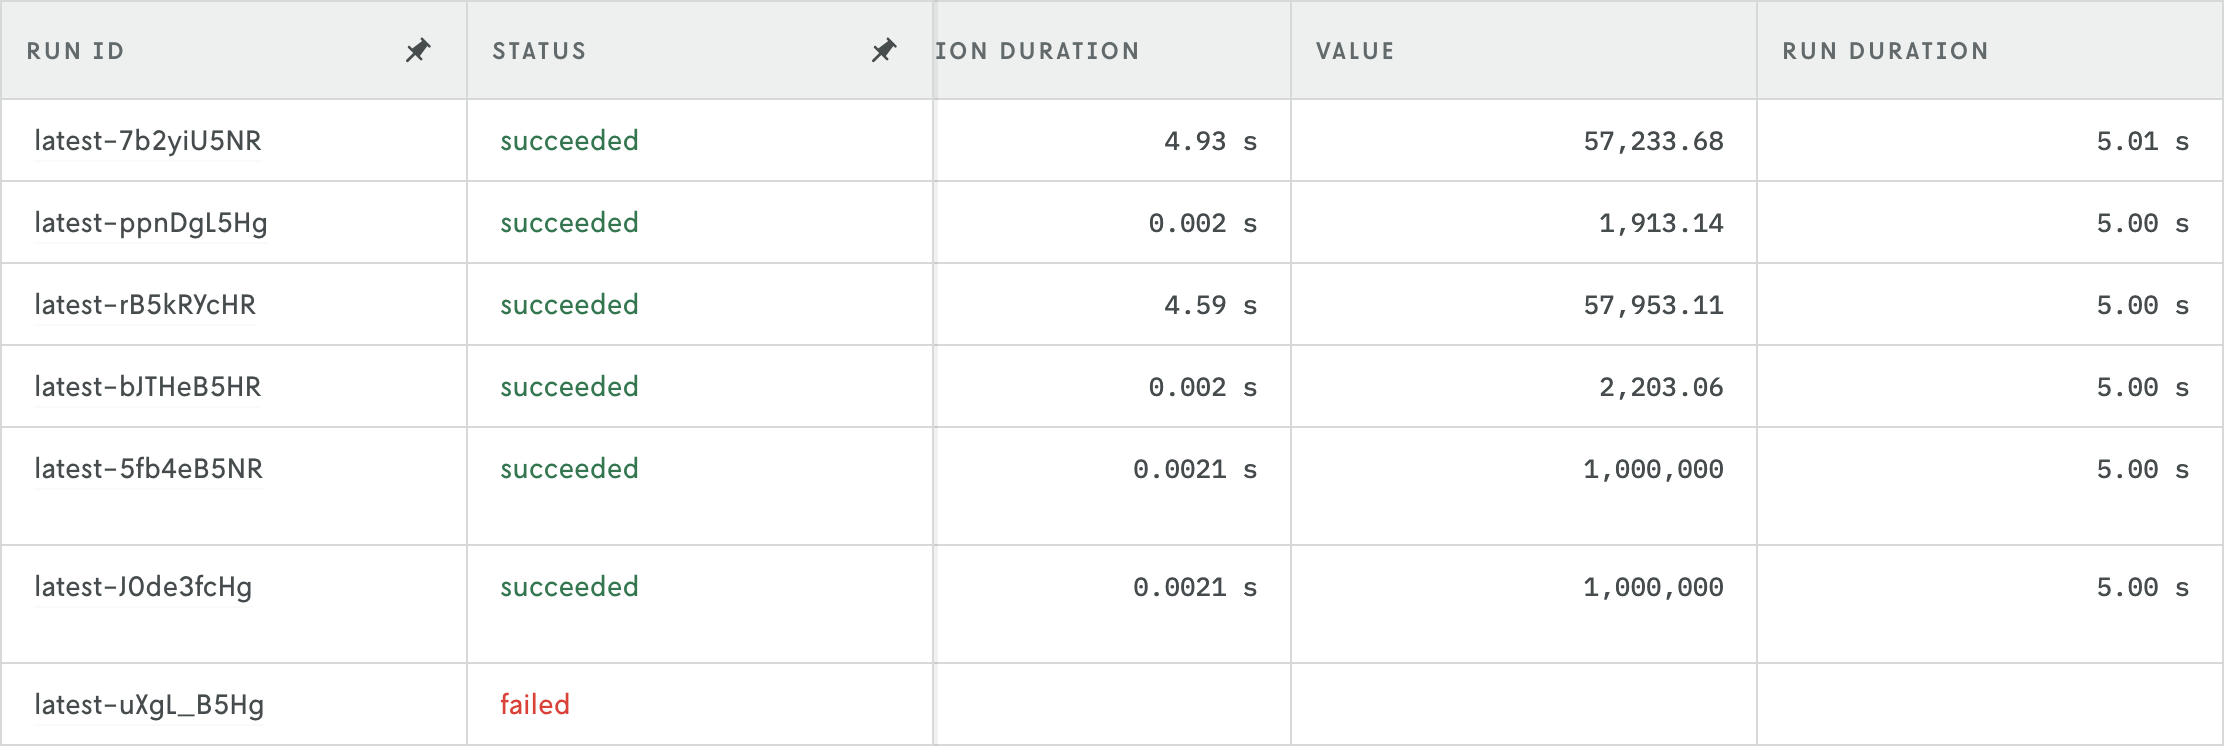
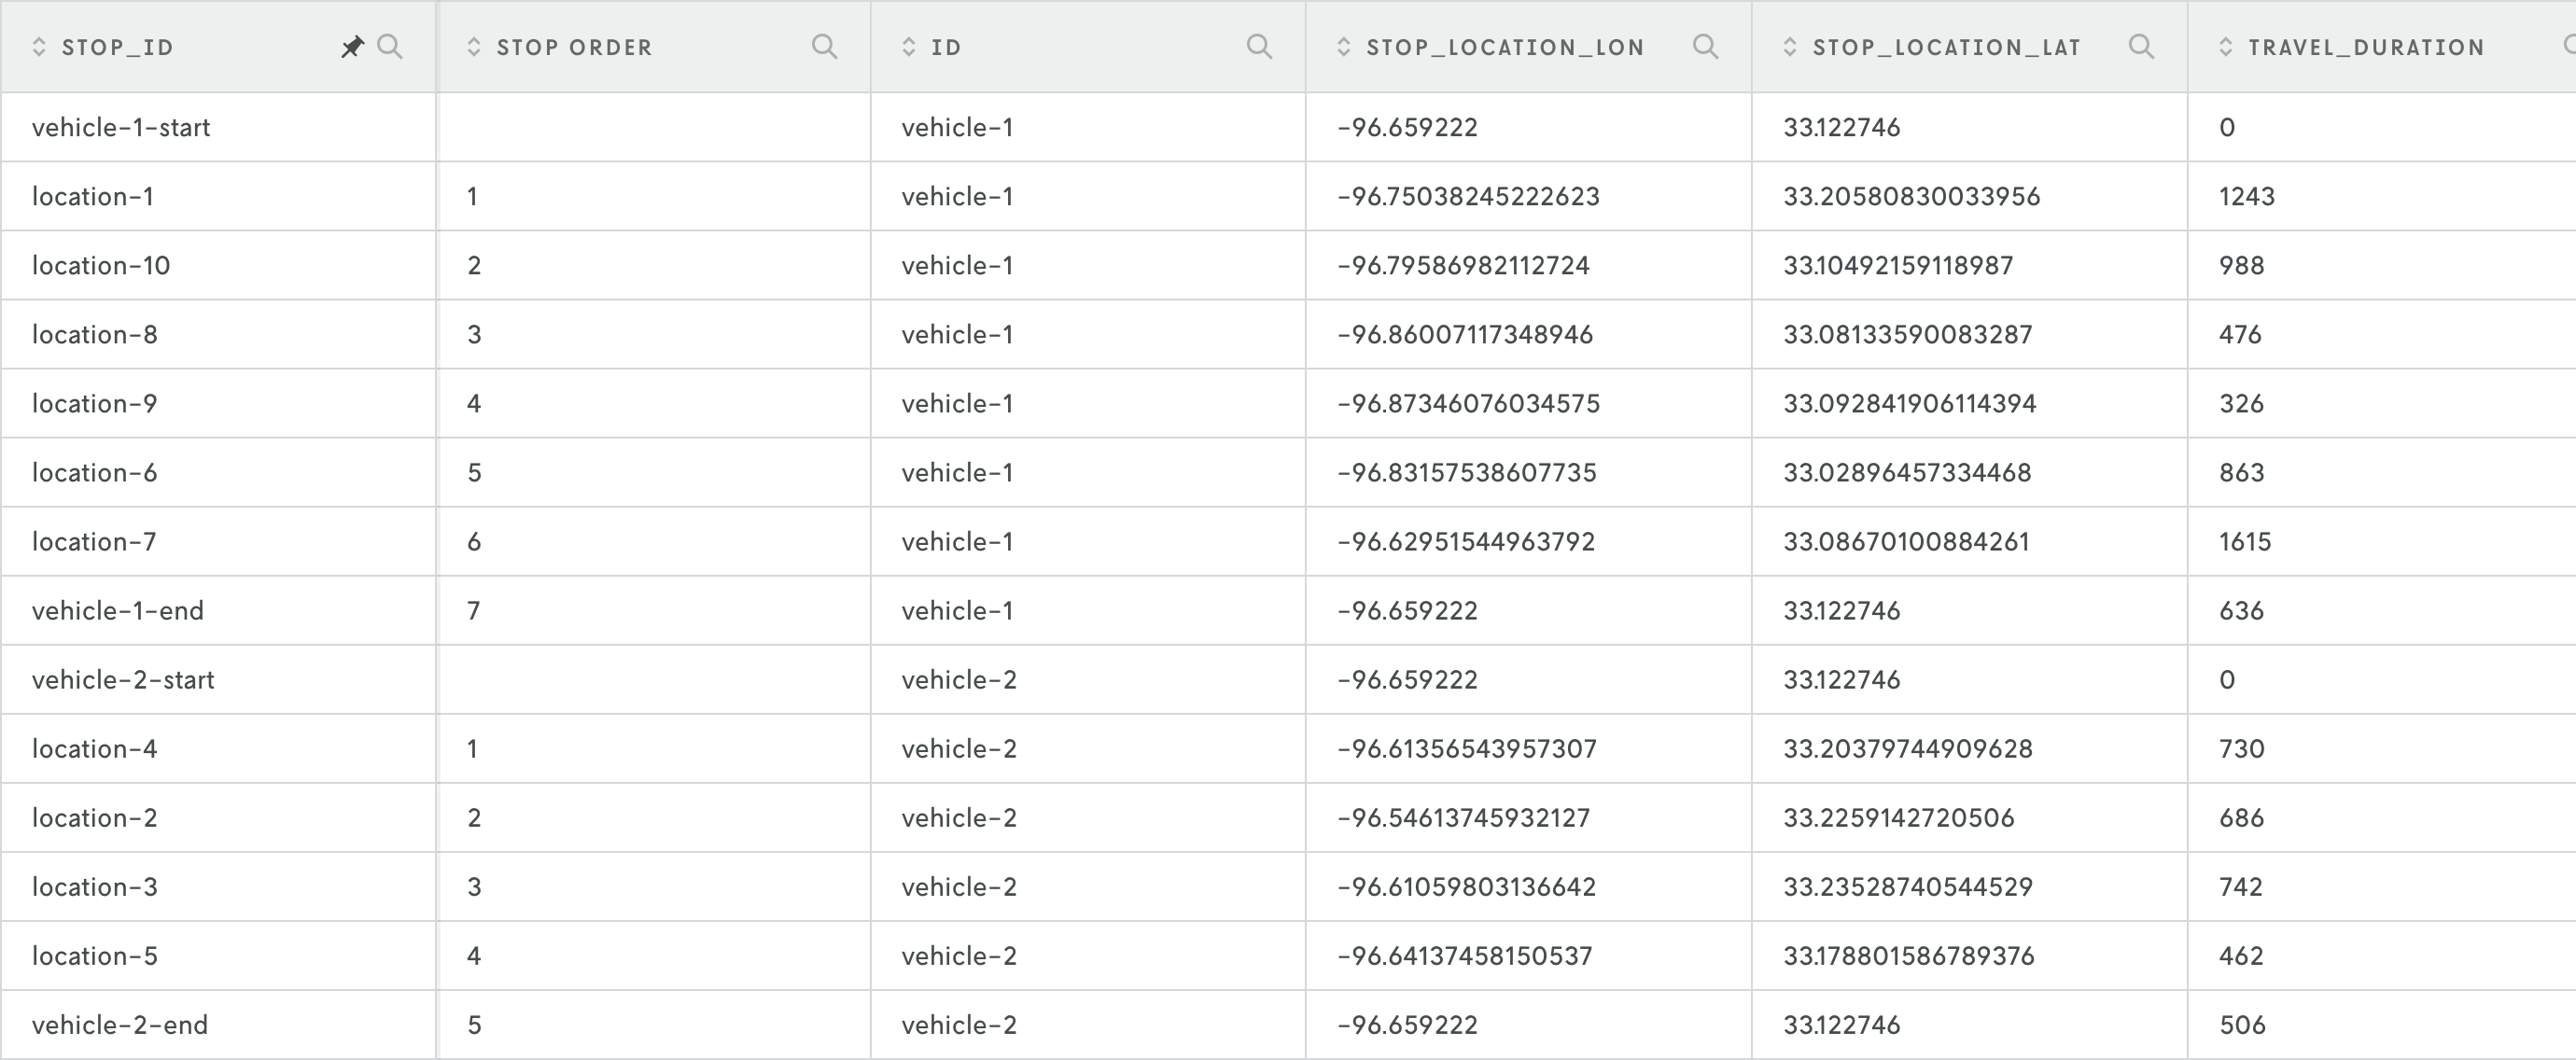
A new column pinning feature for table views has been added to Nextmv Console. Now when viewing table data you can select certain columns to be pinned by hovering over the column header cell and then clicking the pin icon.
To unpin the column, just click on the filled-in pin icon and the column will return to its normal location in the table. You can pin as many columns as needed.
nextmv-v0.22.0
April 21, 2025What's Changed
- Support running with nextmv.Input and nextmv.Options by @sebastian-quintero in #79
- Adds stop condition to polling mechanism by @sebastian-quintero in #80
Manage secrets in Console
April 21, 2025
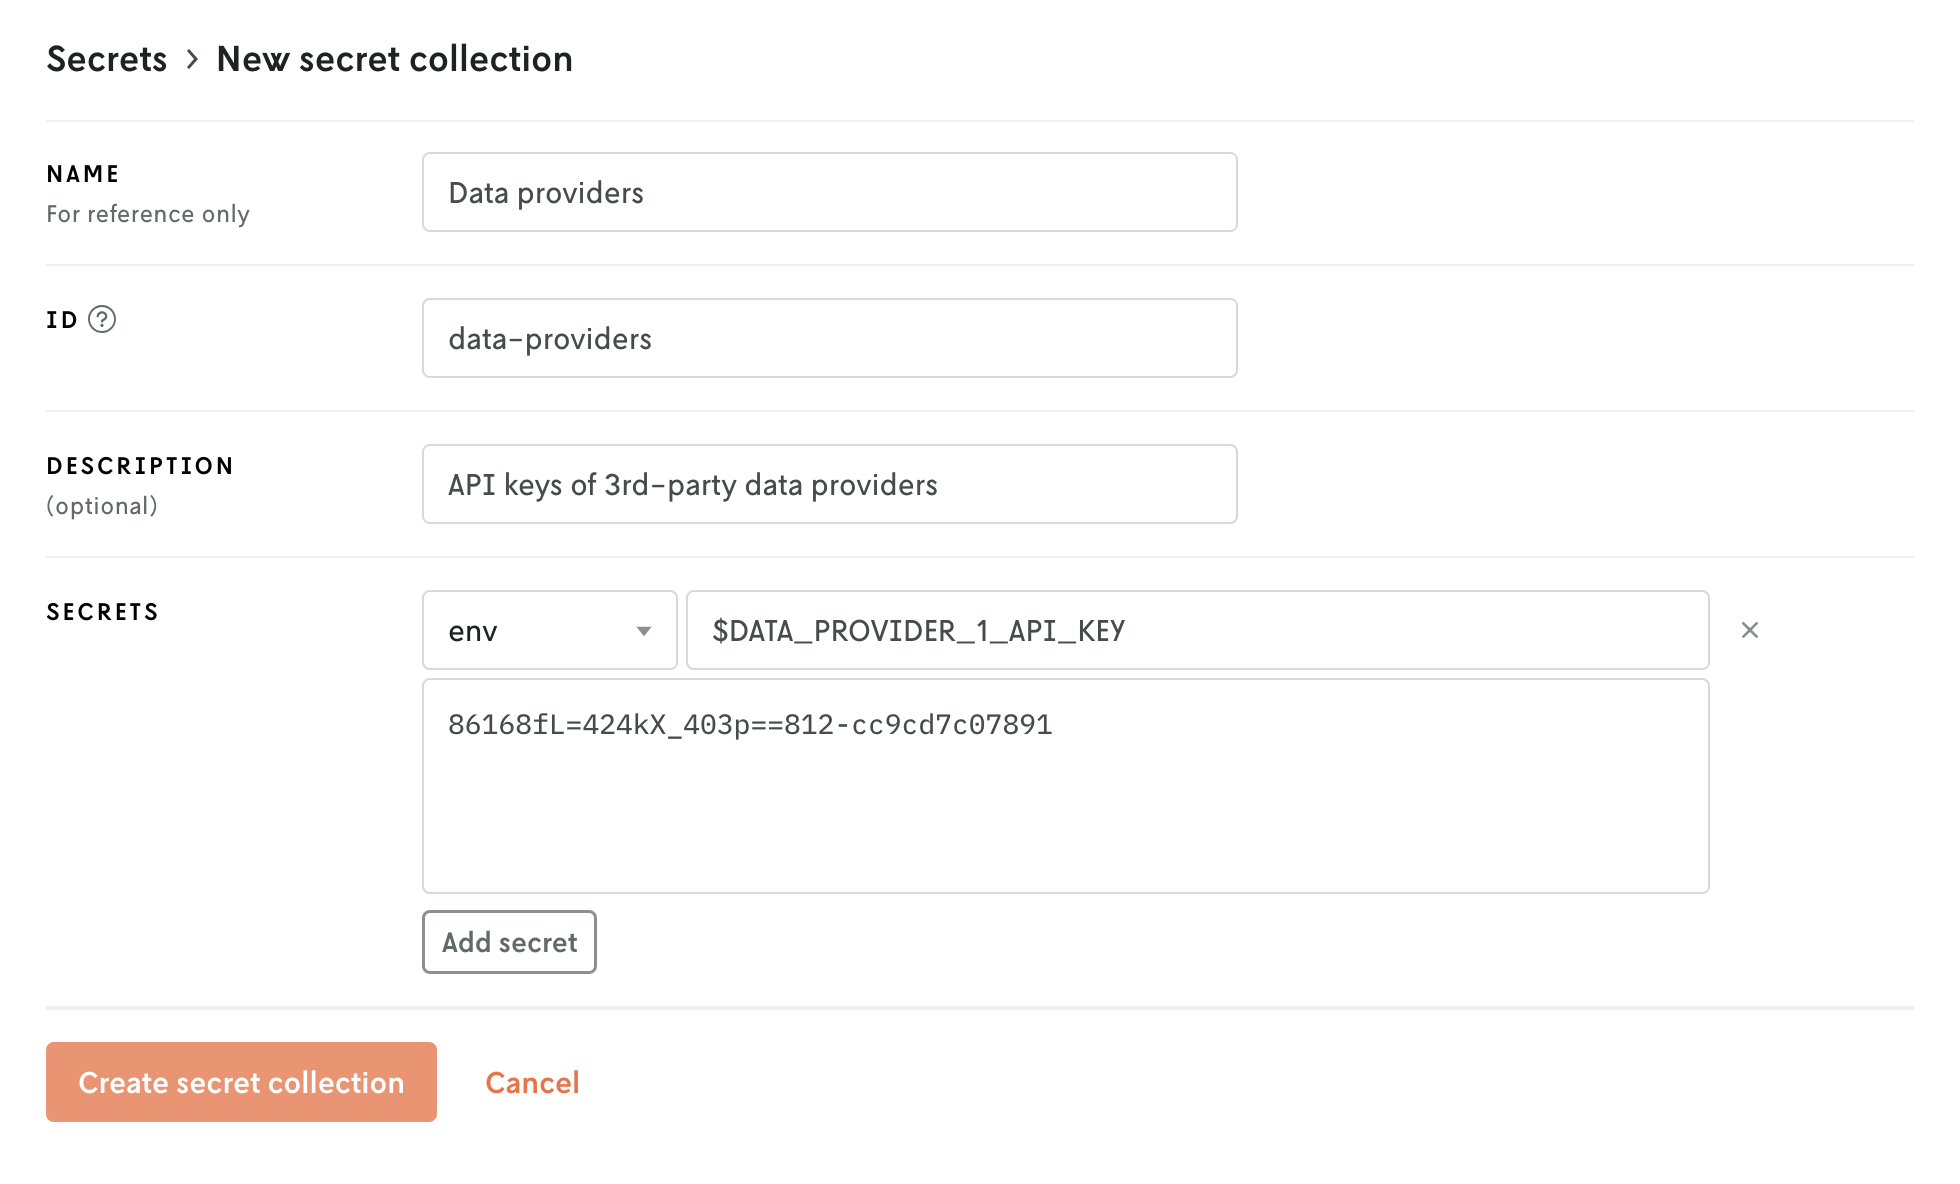
The ability to manage secrets in Nextmv Console is now available. You can add new secret collections and assign them to instances or individual runs, as well as edit and delete existing secret collections.
Read more about how to use secret collections to enhance your app and workflow functionality in the Secrets collection reference section in Nextmv Docs.
nextmv-v0.21.1
April 17, 2025What's Changed
- Adds support for exist_ok on new app by @merschformann in #77
- Improves order of checking whether app exists by @merschformann in #78
nextmv-v0.21.0
April 17, 2025What's Changed
- Add functionality to track a run (use external runs) by @sebastian-quintero in #76
v0.1.5
April 17, 2025What's Changed
- Adds support for running in jupyter notebooks by @merschformann in #12
Full Changelog: v0.1.4...v0.1.5
v0.1.4
April 9, 2025What's Changed
- Improves status updates for failed flows by @merschformann in #11
Full Changelog: v0.1.3...v0.1.4
Share view and other actions
April 8, 2025
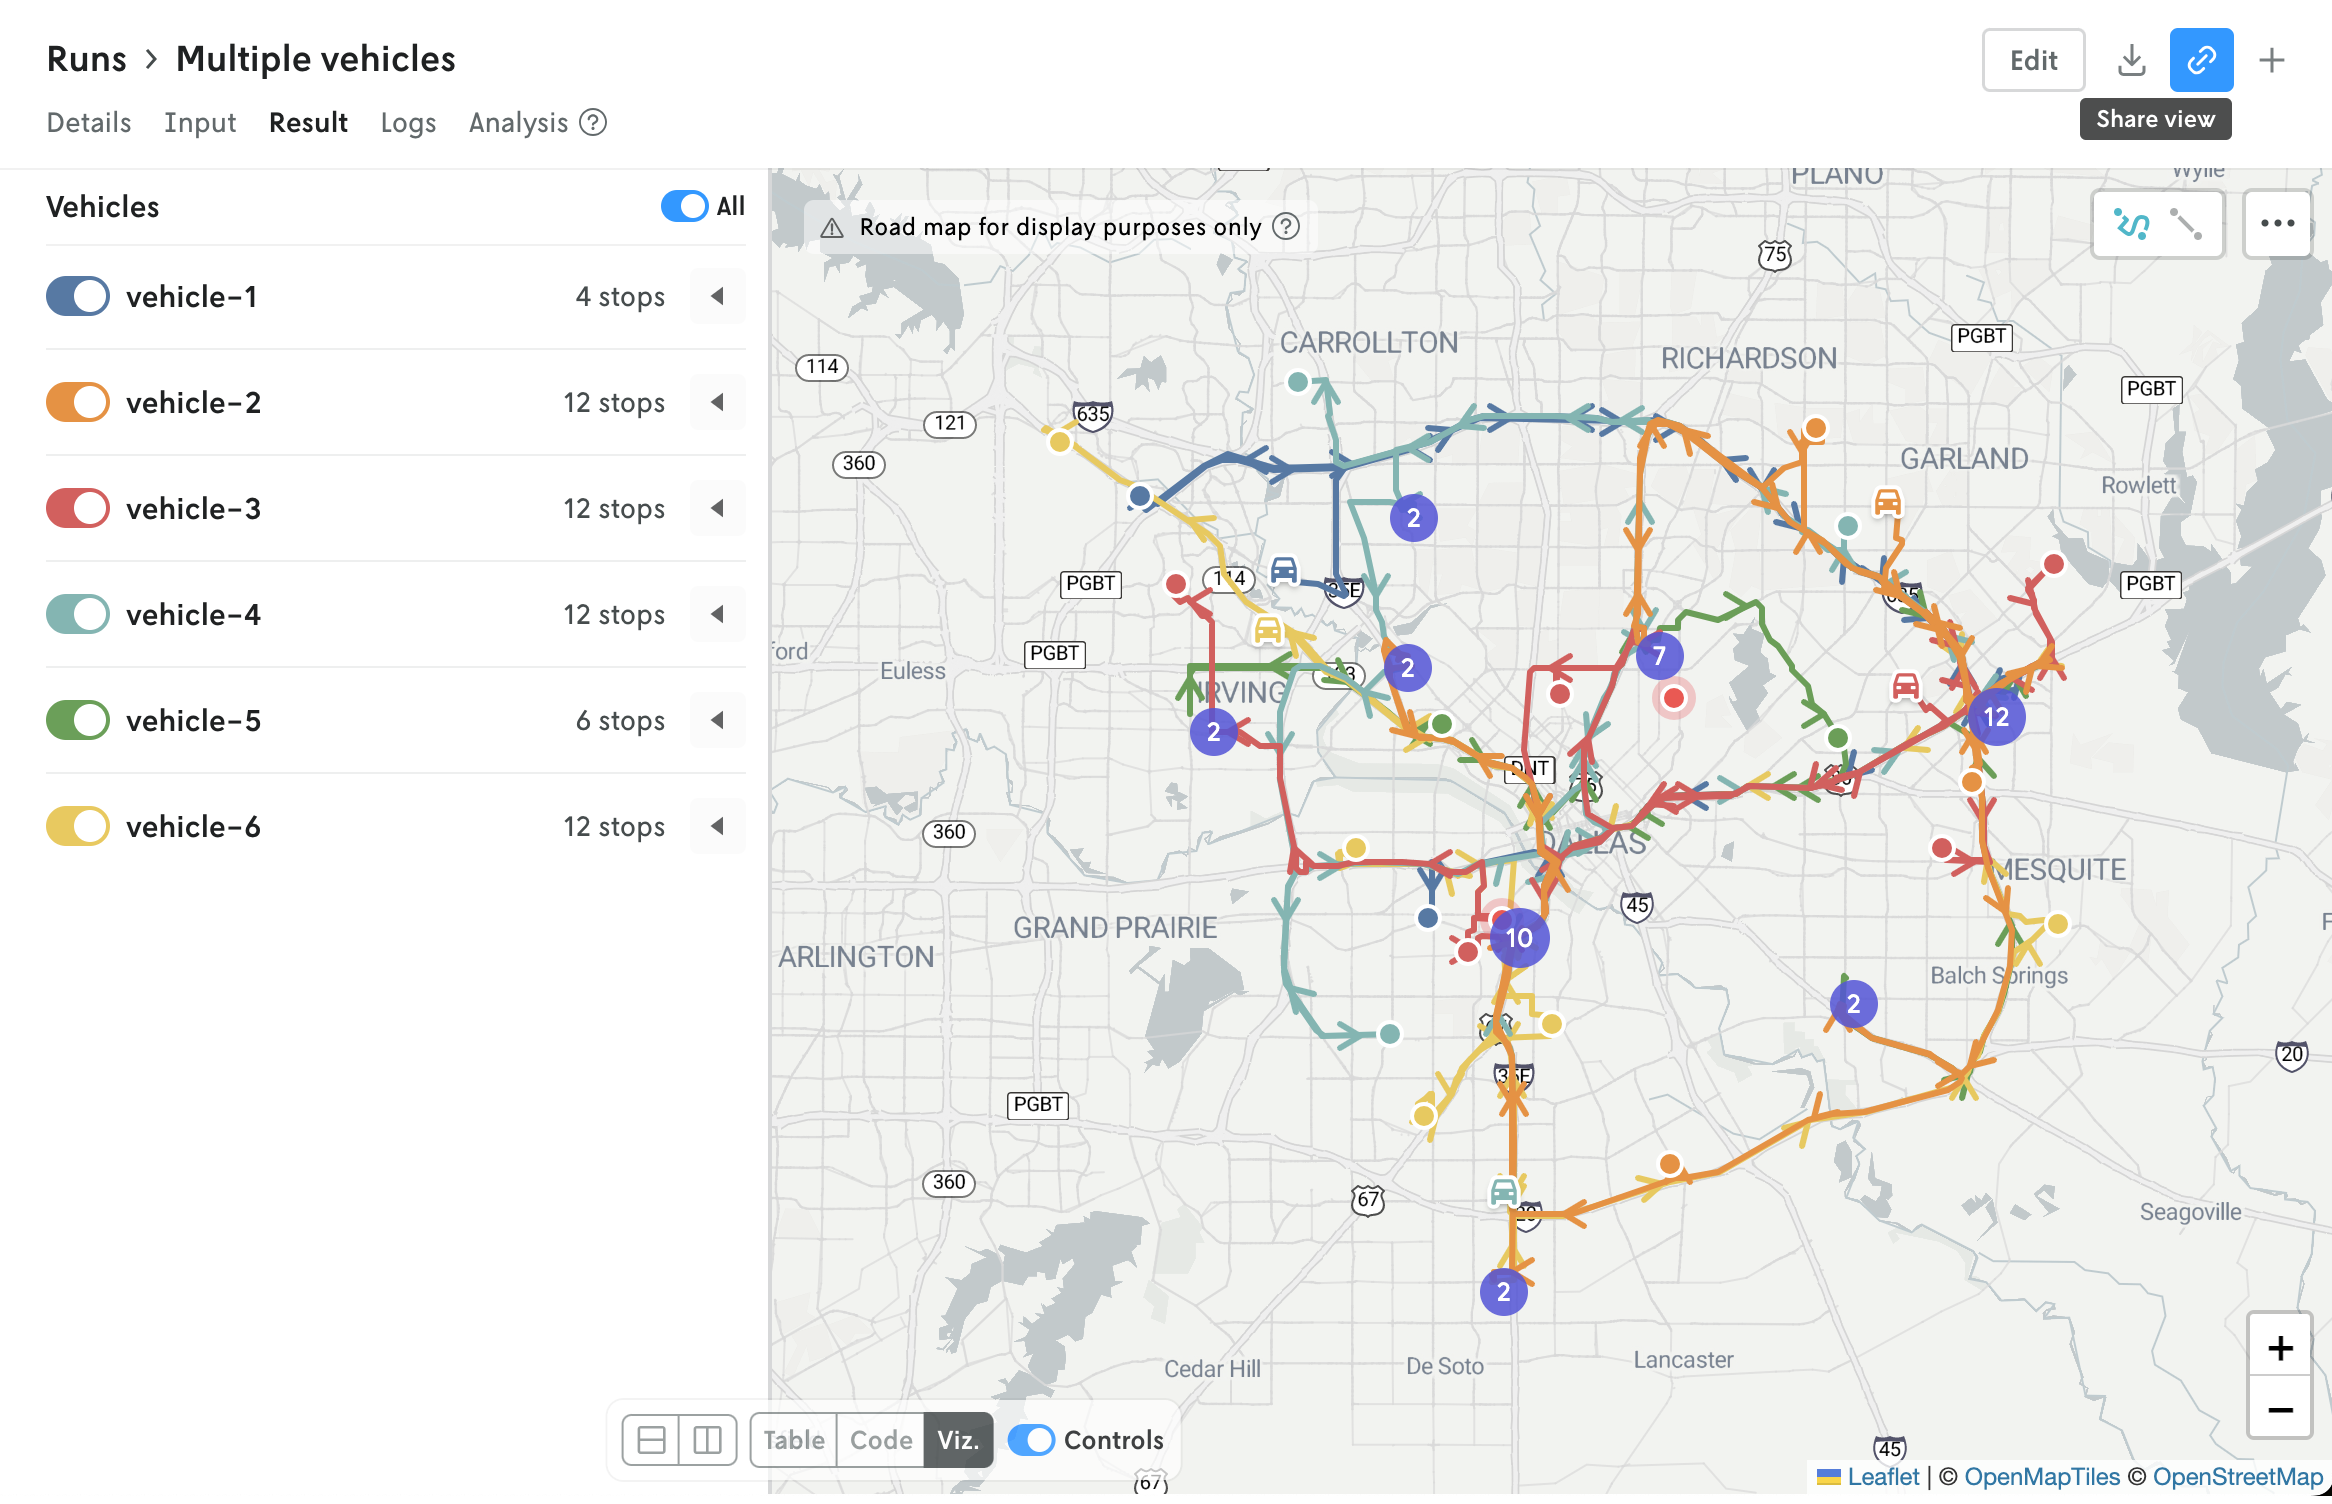
You can now share a run URL with someone on your team and it will preserve the particular view that was shared. Before, if you were, say, on the Result view of a run and copied the URL to share with someone on your team, when they opened that URL they would land on the Details view. This produced a confusing experience when trying to share views.
Now, when you click the share view button, your current run view is copied as part of the URL and will open the run on the same view from which it was shared. Further, the URL will preserve the specific data and layout selections for that view if applicable. For instance, if you are viewing the result of a routing run with a split table and run visual, when you copy the link to share the URL, it will open on the Result view with the same split table and run visualization displayed.
In addition to this new share action, the create new and clone existing run action has been given a small makeover, and download input and output have been consolidated into a single download menu.
Create/clone new run
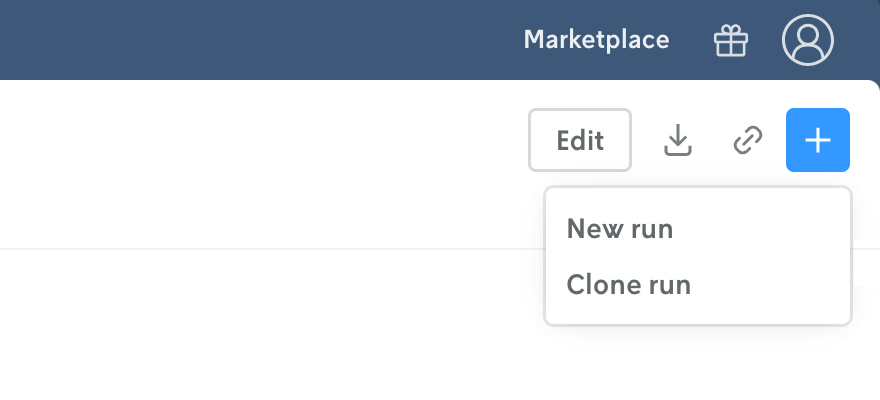
The ability to create a new run and clone an existing one was already in place, but it has been revamped with a universal + action button that opens the menu of create options. This will also serve as a place for any future create new actions for runs and other entities.
Download input and output
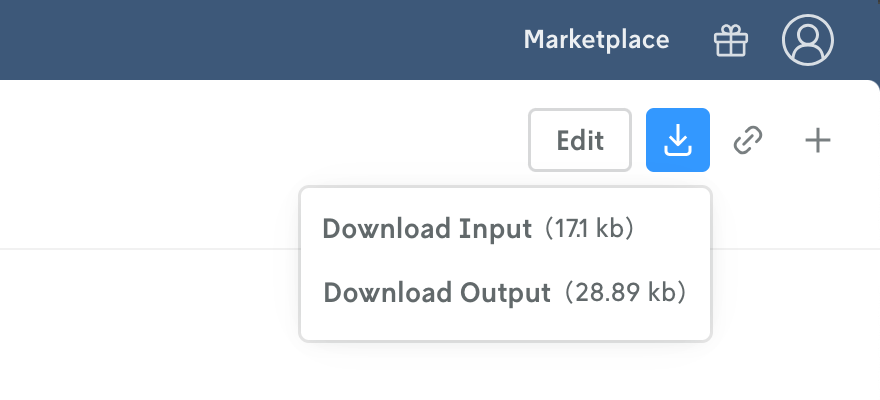
The ability to download a run’s input and output file existed prior as well, but the UI to do so was only available on the Input and Result view respectively. And depending on the type of application or the run size, the UI to download the input or output could vary slightly. This update consolidates the download actions into a single menu that is always accessed from the same place and from any view.
Tabular data view for runs
April 3, 2025
All JSON-based application runs now have an automatic tabular view into the data. For a run result, the solution is extracted and presented in a tabular view; for the input view the full input data is used for the tabular view.
How the data is presented (code and table) can be toggled with a new control at the bottom of the page as well, so you can easily switch between JSON and tabular views of the data. The code view displays the input or output for a run like it did before, there is no change there, so at any point you can view the exact input or output for the run.
This update has been applied to new and past runs. Also, the view control will remember your last selection for the app, so each app can have its own default view into the data for each individual user.

Updated routing visuals
March 13, 2025
The routing run visualization in Console has been updated to use vector-based tiles, render more efficiently, and offer more display flexibility.
Vector tiles
The map on which routes and stops are displayed is now rendered with vector tiles rather than raster tiles. This reduces the amount of processing needed to display the map and offers a crisp, clear background for your routing visuals.
Efficient rendering
A number of improvements were made to the code that prepares and processes the data for the routing visuals. And, when possible, items on the map are now rendered with the canvas element rather than rendered as SVGs. In addition to these enhancements, a clustering engine (supercluster) was added to be able to handle efficiently rendering many points on a map.
The size limit for rendering runs in Console with the routing visual has now been increased to 4.5 MB (prior the limit was 350 kb).
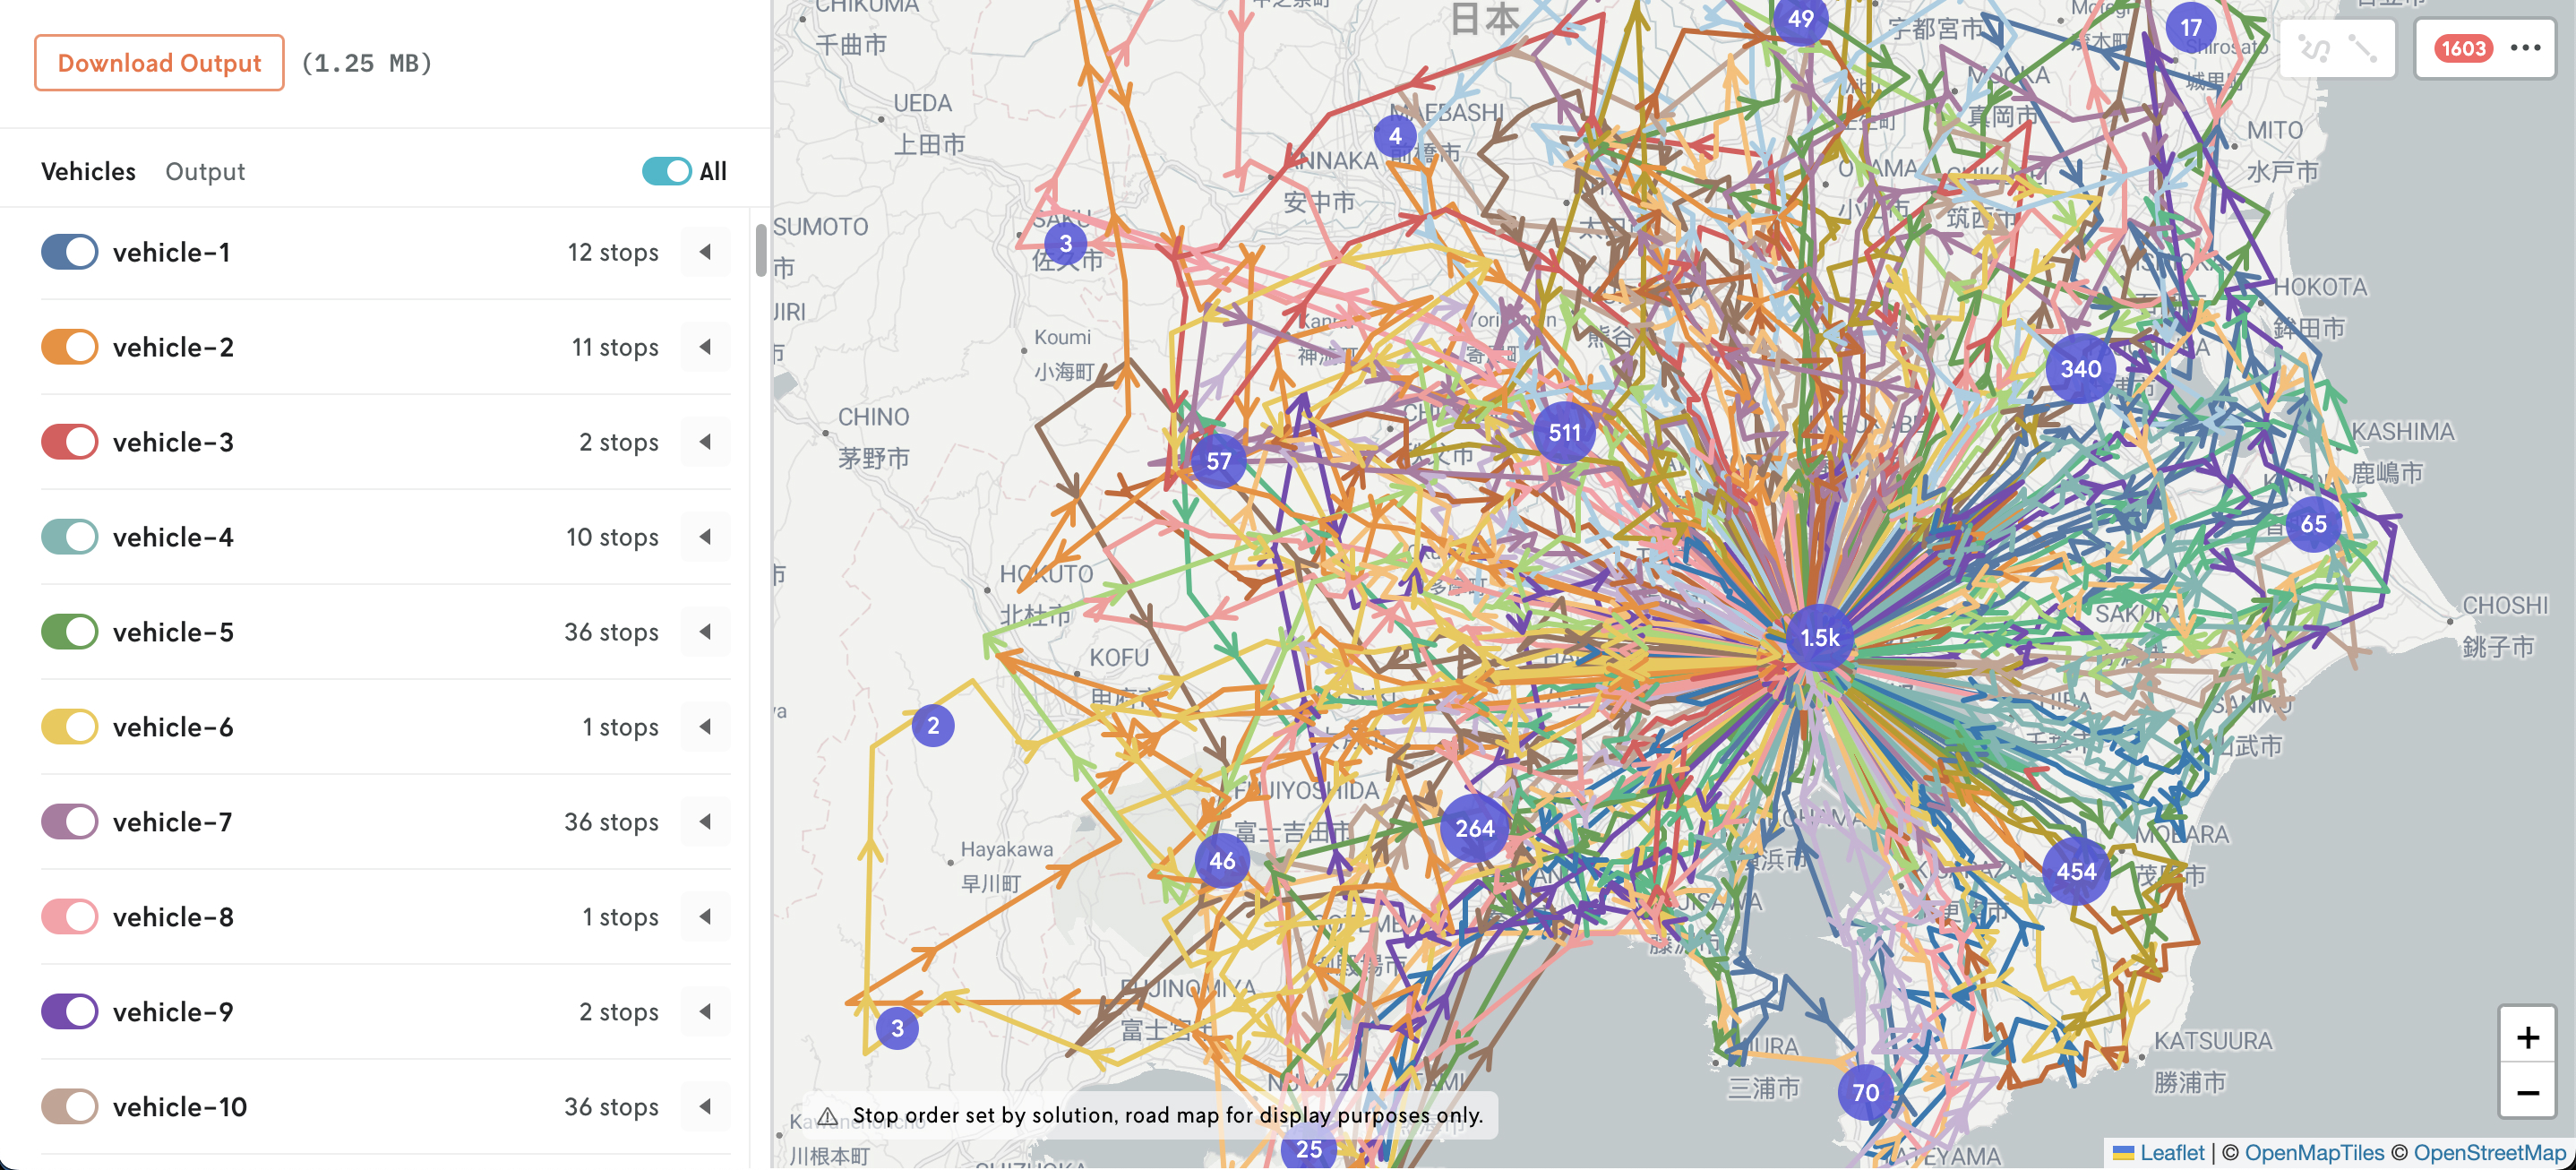 Example rendering of 1000s of stops and multiple routes
Display flexibility
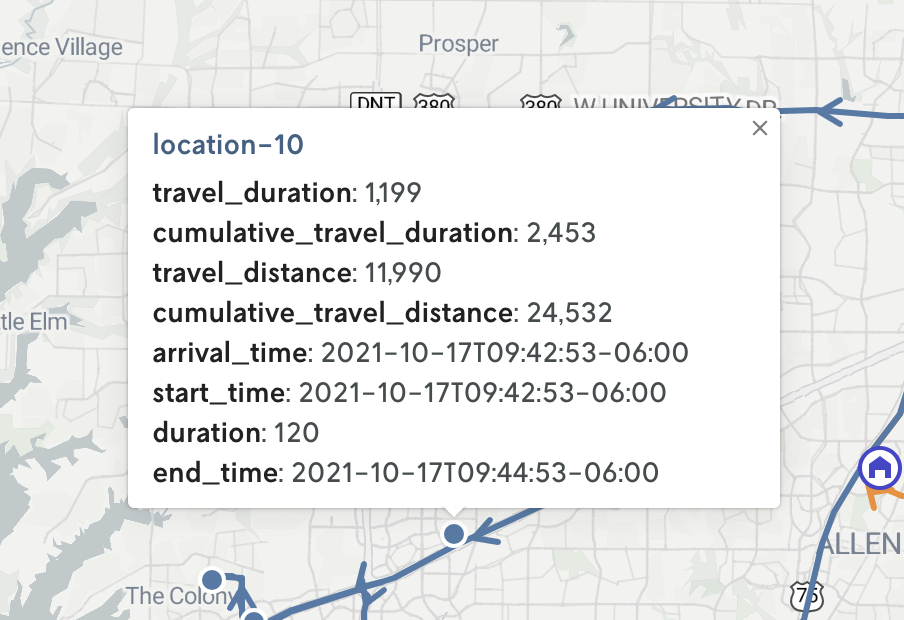
If you click on a feature (point or route) in the map a popup appears that displays extra information for that feature. Before, the routing visualization would extract a few specific metrics for display in the popup, but you had no control over which items were displayed.
This has been changed to where now the popup will display any information that is included in a feature’s metadata property. So now you’re in control of the information displayed in the feature popups.
More
The routing visual is available to any app that meets the minimum schema requirements. You can view this minimum schema and learn more about the routing visual in the routing run visualization section.
Custom run visuals
February 27, 2025
You can now add custom visuals to your application runs. Add custom charts using the Plotly or Chart.js rendering library, or add custom interactive maps based on GeoJSON data. Visuals can be added to any custom application by following the required schema outlined in the Custom visualizations documentation.
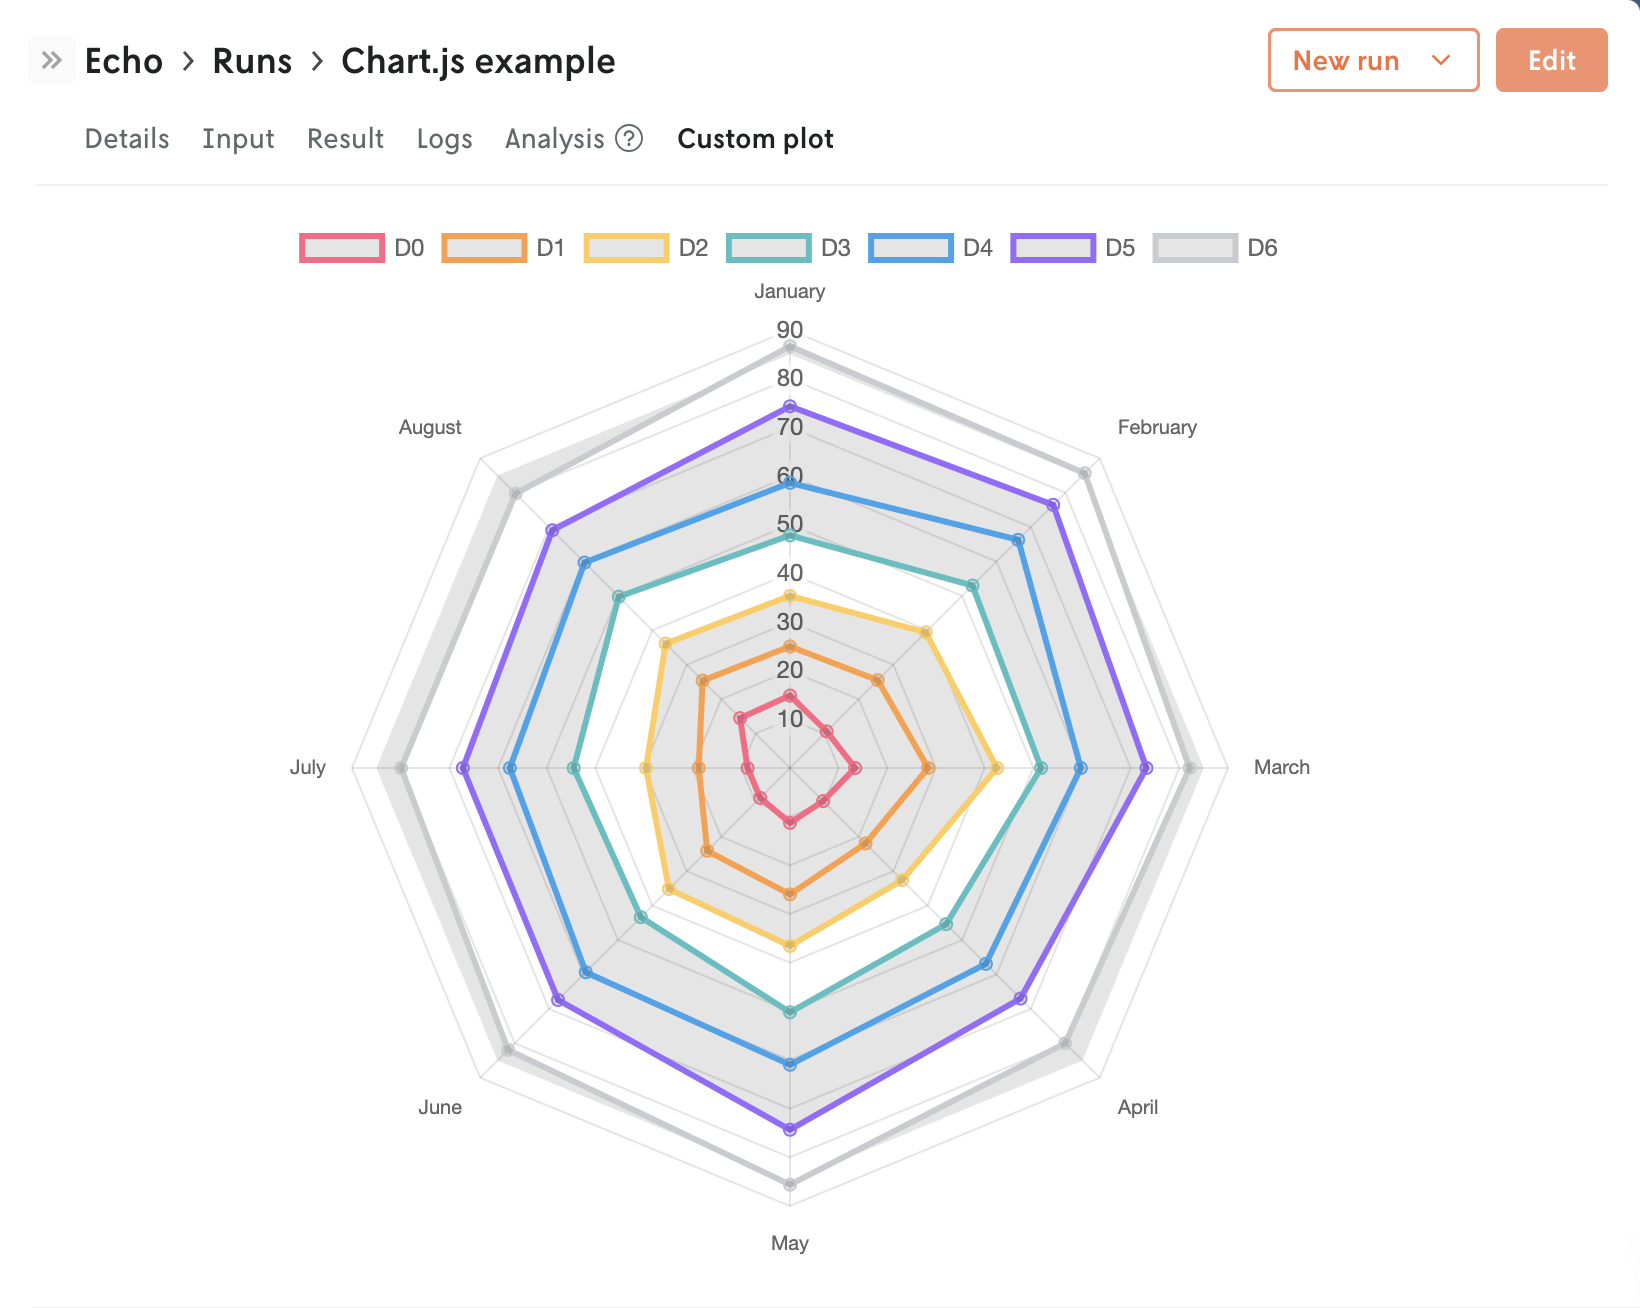 Sample of a Chart.js render for an application run.