An application run typically has an input (the problem) and an output (the result, or solution). When you view an application run in Console, there are several default views that help you understand and explore this data.
However, there are often additional views into the data that are unique to your situation that are not covered by the default views. With custom run assets you can add your own custom views to a run in Nextmv Console with custom visual assets using the data from your model run or any steps in your decision workflow.
A custom visual asset is just a custom asset with an additional visual property that defines the type of visual and how it should be rendered. When this is defined, Nextmv Console treats the custom asset not as something that should be packaged for download but rather as content that should be rendered in the browser.
Supported visual types
There are currently three supported custom visual types:
- GeoJSON — Create your own interactive maps using the common standard for geospatial data exchange.
- Plotly — Create your own plots and more with the powerful JavaScript library.
- Chart.js — Create charts, plots and more with the performant JavaScript library.
You can mix and match custom visuals on a single run as well. That is, you can have a custom GeoJSON map in one tab and Chart.js charts in another tab. Also, for the two charting libraries you can multiple charts under a single tab.
The custom visual pages linked above (and in the sidebar) have more information on each custom visual type.
Limits
Custom visualizations are just extended custom assets and thus follow the same limits as custom assets.
Schema
A custom visual asset is a custom asset with an extra visual property that defines which type of visual it is. Like all custom assets, the custom visualization data must be placed in a top-level assets property of your output JSON.
This assets block must be an array of objects with the following properties:
| Property | Type | Description |
|---|---|---|
name | string | Name of the asset. For custom visuals this is not currently used but it should be treated as a display item for the end user. |
content_type | json | Defines the content type for the custom visualization. For now, only content type json is allowed. |
content | JSON | This is where the custom data to be rendered is placed. Refer to the custom visual type’s subpage for how the data for that particular data type should be defined. |
visual | VisualSchema | The visual schema defines the type of visual and its properties. See the Visual schema section below. |
description | string | (Optional) Any additional information you would like to show to the end user. For custom visuals, if the description is defined it is included as a tooltip next to the custom visual tab. |
Define visual schema
The VisualSchema definition for the visual property must include the information defined in the table below.
| Property | Type | Description |
|---|---|---|
schema |
| Defines how the visual data should be interpreted and rendered on the front-end: geojson tells Nextmv Console to render the custom asset data as GeoJSON on a map, plotly tells Nextmv Console to render the custom asset data with the Plotly library, and chartjs tells Nextmv Console to render the custom asset data with the Chart.js library. |
type | custom-tab | Defines the type of custom visual, currently there is only one type: custom-tab. This renders the visual in its own tab view of the run details. |
label | string | The label for your custom tab. |
Example
Combining the schema definitions above, the definition for a custom visual that renders GeoJSON would look like this:
Demo
Follow the steps below to create a quick demo app that does nothing but print the input as the output. You can then use this custom app to quickly test out the different visualizations by pasting the demo code in the input, running and viewing the result.
Keep in mind that this is just a non-functional app that echos the input as output and therefore can be used to mimick what the output would look like for an with custom visualization as part of its standard output.
1. Install Nextmv CLI
We will use Nextmv CLI to clone a community app and then push it as a custom app. So if you don’t have Nextmv CLI installed, follow the steps on the Nextmv CLI install guide to install it on your machine.
After it has been installed, move to the next step.
2. Clone community app
We will use the python-hello-world community app as the shell for our demo app. Install the community app with the following command:
This will create a python-hello-world directory. In this directory you will find a file named main.py. Open that file and replace its entire contents with the following:
3. Create & push custom app
Run the following command in Nextmv CLI to create a quick demo custom app:
Then make sure you’re in the python-hello-world directory and run the following command to push your demo app to Nextmv Cloud:
Now if you log in to Nextmv Console and navigate to your custom apps you should see the new Echo custom app. You can now use this custom app to view and test the different types of custom visuals.
4. Run test custom visual assets
To quickly test any of the custom visuals, choose from the tabs below and then copy and paste the input into the JSON editor for a new run and then run the app.
Depending on which visual you ran, the output should contain either a Custom map or Charts tab and clicking on that tab should reveal the custom visual.
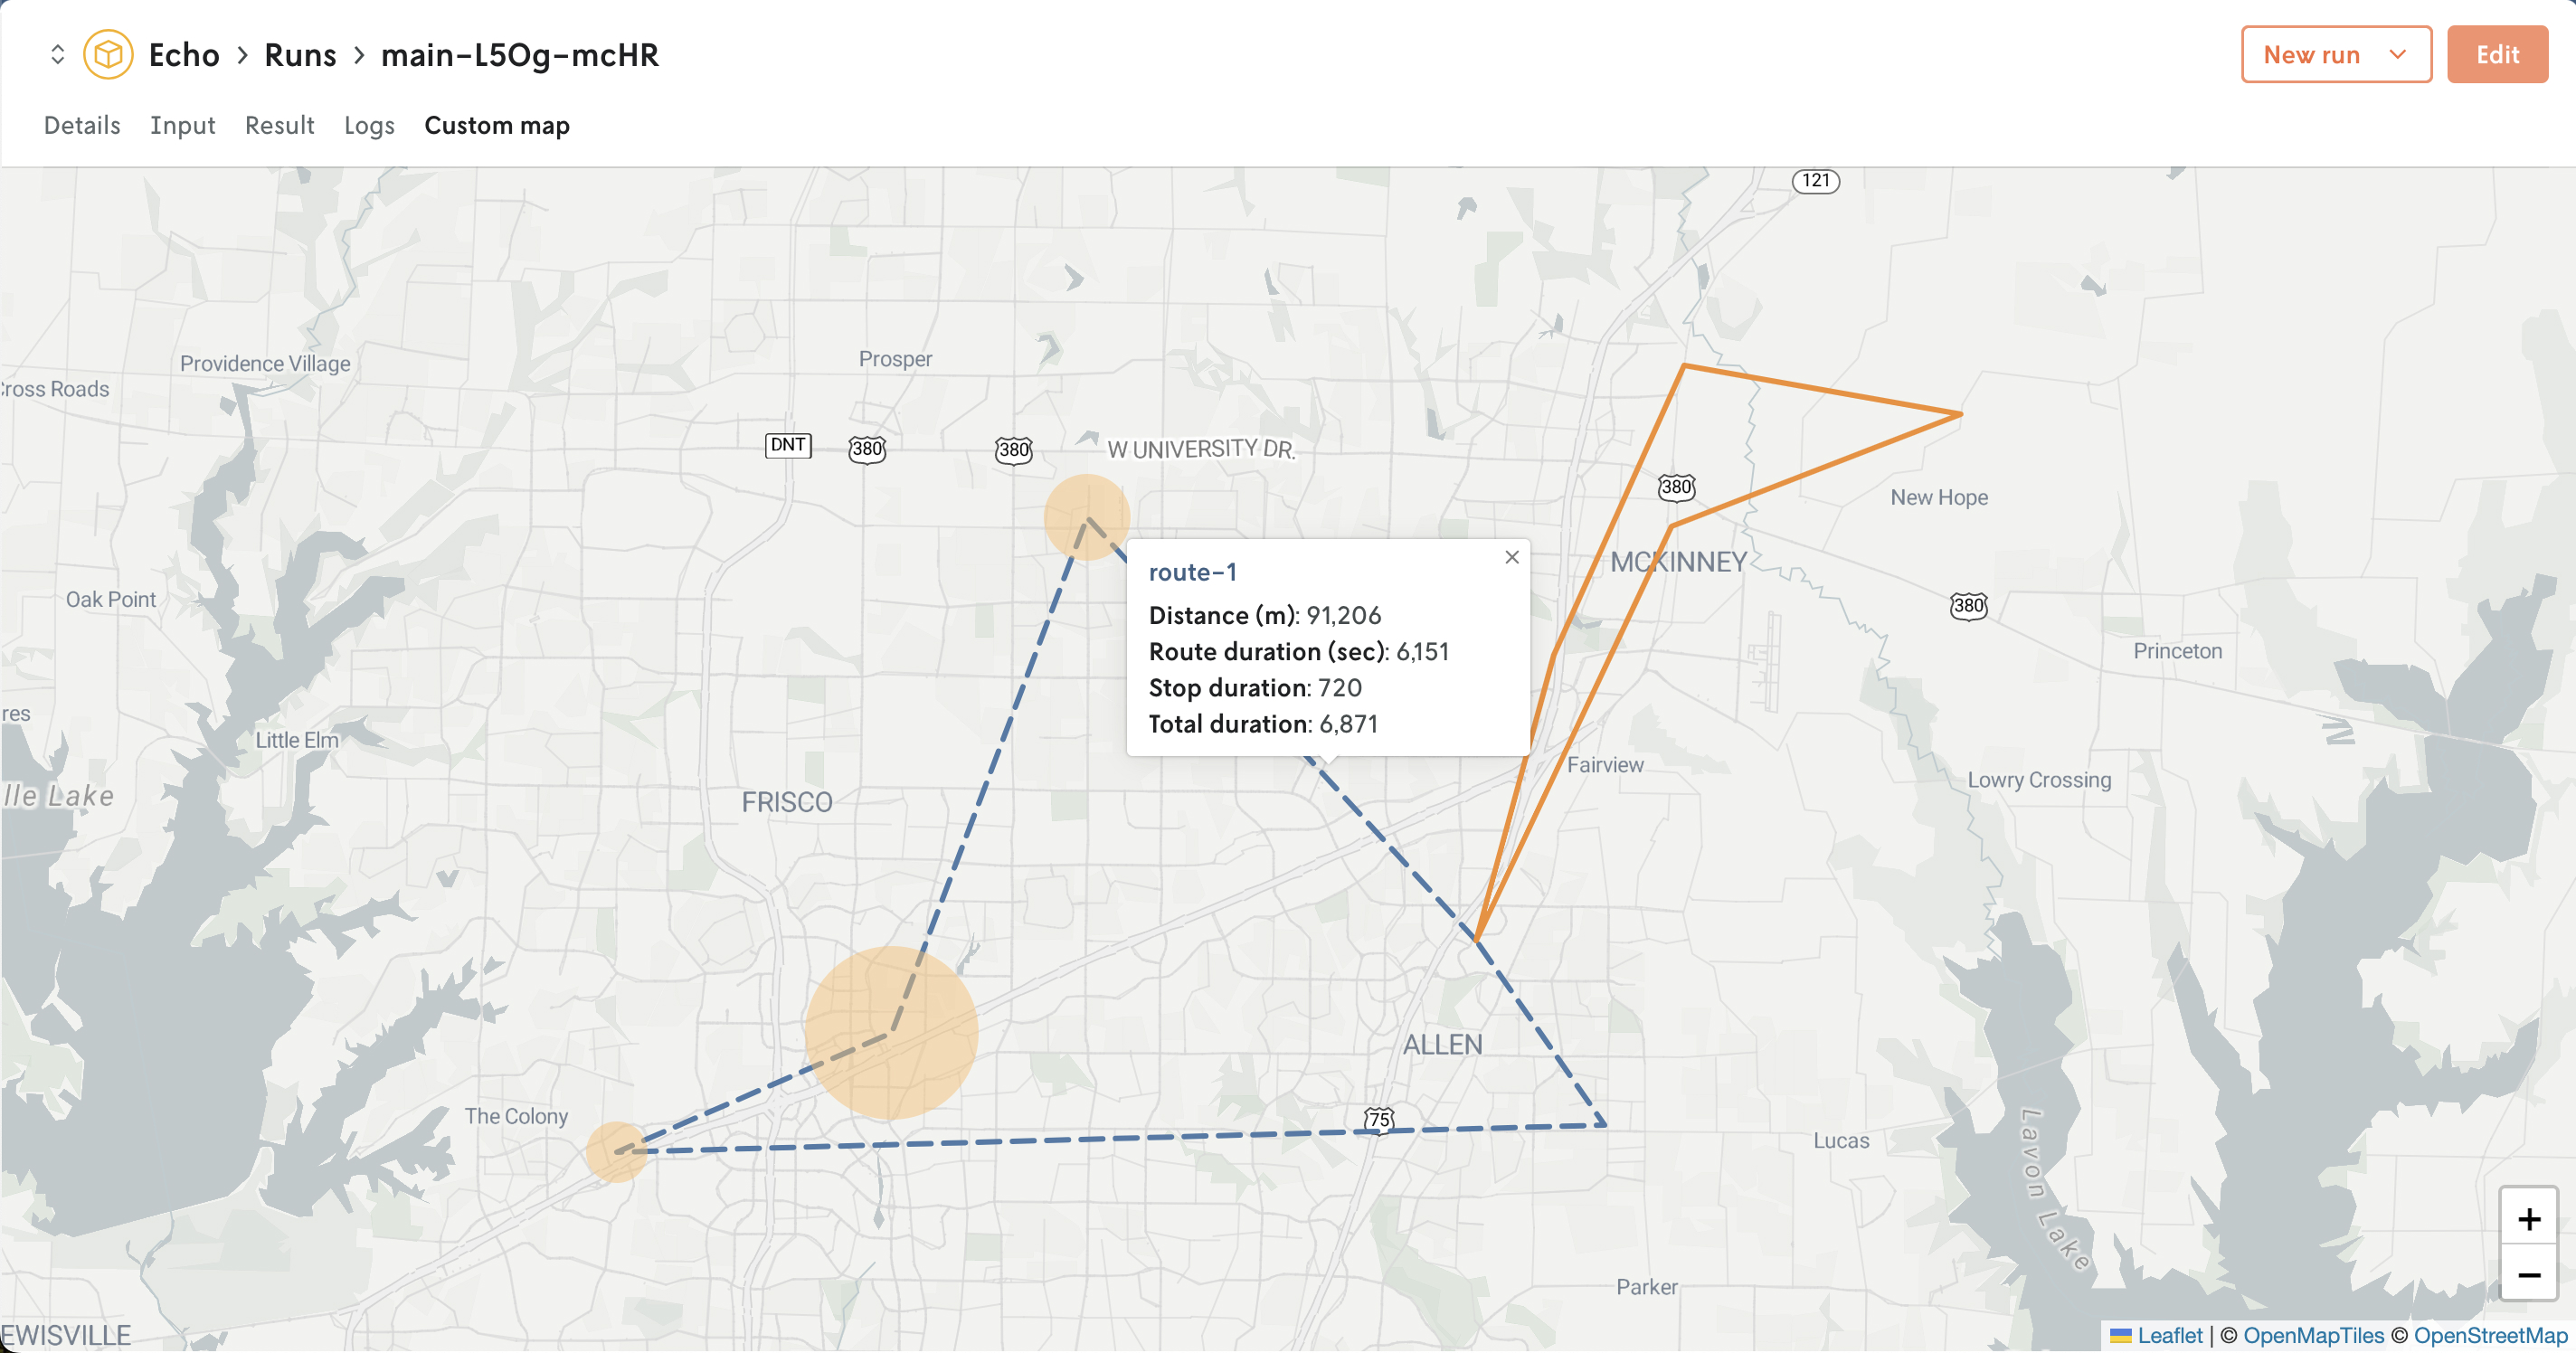 Custom map powered by GeoJSON custom visual asset.
Explore further
Learn more about each custom visual with the links below:
- Learn how to add a custom interactive map.
- Learn how to add Plotly charts.
- Learn how to add Chart.js charts.