


Optimization is a powerful, mature technology dating back to the 1940s that improves logistics and planning. Optimization models (also called decision models) are well known constructs used to solve optimization problems among operations researchers and decision scientists, but are relatively new to many others who rely on predictions and manual planning for their operations. Encouraging broader awareness and adoption of optimization models is a recurring topic among practitioners.
For instance, last week, the organizers behind the inaugural Practical Optimization Sprint facilitated discussion about where optimization is underutilized and ways to introduce it to more audiences. One panelist suggested creating opportunities to make optimization more real for people: Select an area you’re interested in (local craft beer production, perhaps), study its operations, and create a solution that tangibly improves the workflow of real users.
Along the same lines, a recent Gurobi Summit presentation explored everyday moments in which optimization adds value but may go unnoticed. For example, did you pour milk into your coffee today? Or spread butter on toast? The quality and availability of those dairy products are part of an optimization process.
But instead of going big and reviewing all the great ways optimization gets applied today or all the ways it could be applied in the future, I wanted to go small. What is one tangible way to make the benefits of optimization feel real?
This got me thinking about Lasagna Love, a meal-delivery nonprofit that distributes homemade lasagnas from volunteers’ homes to nearby families. Early on, their delivery operations ran on spreadsheets and Google Maps. But their volunteer base quickly increased from 400 to 4,000. They needed a more efficient routing solution and ultimately implemented an optimization model built by a fellow MIT alumnus.
It’d be easy to stop here and declare the win for optimization models: time was saved and efficiencies were gained! But how worth it was the switch from a known manual process to a lesser known optimization process?
While I don’t know the details of Lasagna Love’s operations, let’s imagine a simplified scenario. Let’s say there are 400 lasagna deliveries to make in one day in New York City. We have 15 delivery vehicles that can each hold 50 lasagnas. How do I efficiently route my vehicles to minimize their drive time while delivering all of the lasagnas?
With a manual approach, all of my delivery stop locations would be captured in a spreadsheet and manually organized into subregions (e.g., boroughs and postal codes). From there, I’d copy-paste each address into Google Maps, one by one for up to 10 addresses at a time (their limit), hit submit, and get routes back. However, this Google service simply gives me a drive time for the stops in the order I entered them — there is no optimization happening here. While I can manually resequence the 10 stops, the route efficiency is still based on my judgment. Let’s say that this 10-stop routing process takes 5 minutes to complete. That means it’d take just over 3 hours to create one plan that routes all 400 stops with, let’s estimate, a total drive time of 50 hours.
(Note: While the journalistic side of me wanted to put the manual approach to the test and perform the process myself, I confess I didn’t have the time. It’s likely my manual time estimates are conservative and my solution value is overly generous.)
Now, let’s explore this problem using an optimization model. Instead of a spreadsheet, I have an input file that represents the 400 deliveries, 15 vehicles, and vehicle capacity. I feed that file into the optimization model, run the model, and within 1 second I’ve got an optimization delivery plan that routes 400 stops with a total drive time of 45 hours.
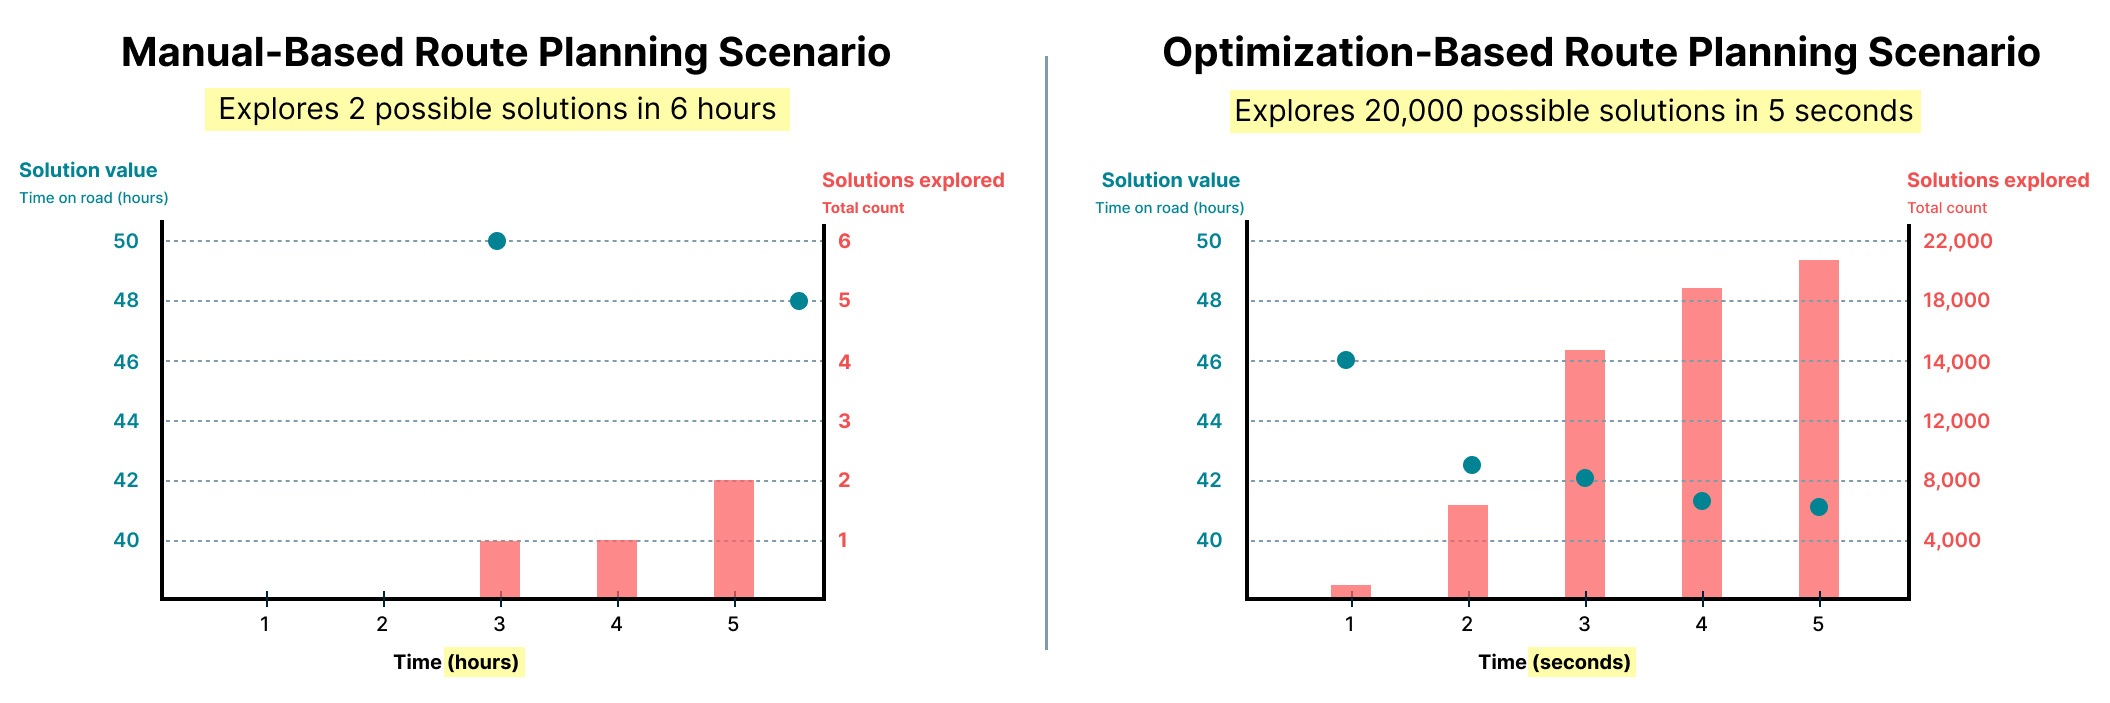
Let’s say we account for iterations in both planning approaches where we allow a bit more time to find improved solutions. With a manual approach, it’s likely another 3-hour process would yield one more possible routing plan that takes one hour off my previous total drive time. But with the optimization model approach, we run the model an additional 4 seconds and explore over 20,000 possible solutions (yes you’ve read that right) to get an improved solution that shaves another 4 hours off the total drive time. 🤯
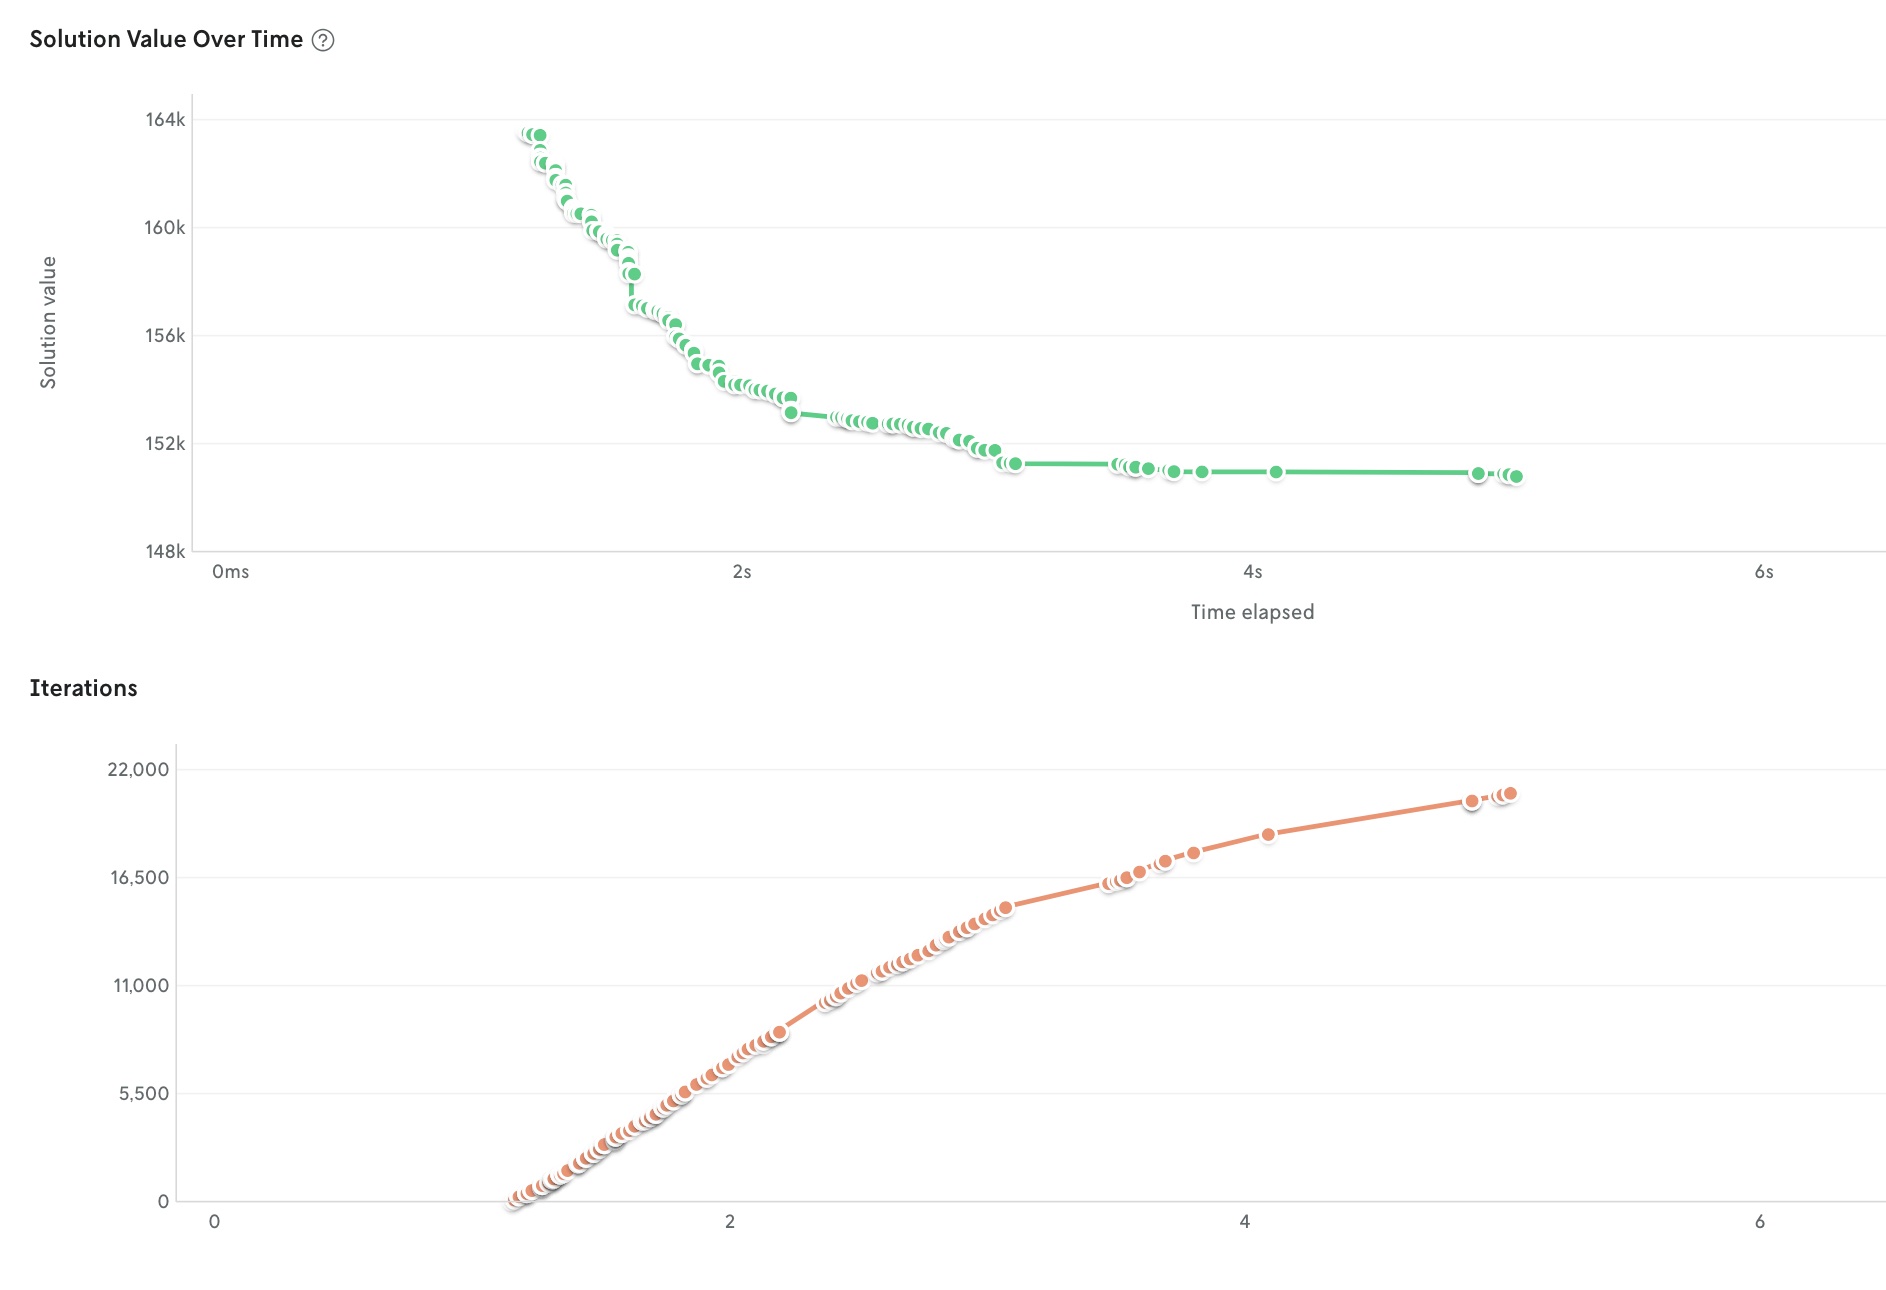
Here’s what this comparison looks like in charts. The optimization-based chart is using real data [1] that I visually reformatted for consistency with the manual-based chart I created using my estimates.
We can also get a sense for the wide range of route plans the optimization model considered by looking at them visualized on a map. In the first gif below, you see some of the explored routes for one of the vehicles over 5 seconds. You can see that the route and stops change from plan to plan. In the second gif, you see some of the explored routes for all 15 vehicles over the same timeframe.
At this point, it should be clearer as to how optimization is a more efficient, comprehensive planning approach: it quickly explores many possible solutions to arrive at an optimized plan that adheres to your rules and requirements. In our example, the manual approach explored (and arrived at) 1 plan in 3 hours and the optimization approach explored 20,000 plans to arrive at a plan in 5 seconds.
“Great, these are impressive results,” you may think. But you may not be rushing into the optimization deep end just yet. Manual approaches are often well understood so they feel safe and comfortable. You, the human, did all the reasoning for the problem — from beginning to end. Most teams and organizations start out with manual approaches, even if they don’t scale. But the goal should be to improve and progress to more scalable solutions.
Making the jump from manual planning to optimization-based planning is an investment. It’s a multi-step evolution, as The Rounds CEO has described, that’s necessary for the business, sustainability goals, employee happiness, and customer satisfaction. Recently, I learned of a different team that dedicates 30+ hours a week to manual planning. Let’s say an optimization model could reduce planning time to just 8 hours per week, now that team can focus on expanding and improving planning across more regions and markets. The team composition stays the same, but there’s more opportunity to increase business value while minimizing team burnout.
And then there’s the issue of trust. Trust, regardless of which planning approach you take, is earned. Monitoring, auditing, and testing are critical to ensuring the safe implementation of quality plans. Manual approaches feel comfortable because they are often known, hands-on processes. But they are hard to efficiently test and QA. Optimization approaches can feel overwhelming because they’re lesser-known, hands-off processes, but they don't have to be. They are just as easily demystified. While optimization might feel magical, it’s not magic. It’s just math.
Most optimization workflows should have a human in the loop. Testing and validation tools provide natural checkpoints for these human-review workflows to flag irregularities or anomalies in the system. They make it easy to spot when a model update could accidentally break deliveries in a region or allow logistics operators to evaluate and adjust a route plan before implementing it.
I recognize that I’ve layered a lot into this post. My main goal was to demonstrate how optimization models can accelerate manual planning. They generate better solutions more systematically in less time while adhering to your business rules. This can result in more revenue and improved productivity. And it can be done safely and confidently to reaffirm trust with your team and ensure quality for your customers.
[1] Screenshot of the actual chart used to create the bar chart above for the optimization model approach.
.png)


